Visualization using the Integrative Genomics Viewer (IGV)
The Integrative Genomics Viewer (IGV) is a high-performance visualization tool for interactive exploration of large, integrated genomic datasets. It supports a wide variety of data types involved in NGS analysis including mapped reads, gene annotations, and genetic variants.
Author:
Mohammed Khalfan – mk5636@nyu.edu
Overview:
- Launching IGV
- Load pre-existing genome
- Create a custom genome
- Loading alignment data (mapped reads)
- Navigation and interpretation of data
1) Launching IGV
There are a few ways to launch IGV. We’ll cover two basic ways here:
Note: You may need to update your Java in order to run IGV
1) Using the Java Web Start:
- Go to the IGV downloads page: http://software.broadinstitute.org/software/igv/download
- Click the launch icon. The browser will display the web start launch window
- Select Open with Java™ Web Start and click OK. If the system displays messages about trusting the application, confirm that you trust the application. Web Start downloads and starts IGV.
2) Download IGV and launch locally on your Windows or Mac computer. Your computer must meet certain requirements (OS, java version, etc.). Follow instructions on http://software.broadinstitute.org/software/igv/download. When prompted, register or log in as requested. You must register to download IGV. (you’ll need to provide your email address, that’s it)
2) Load pre-existing genome
Data for many commonly studied organisms comes pre-packaged with IGV.
Once IGV is up an running, navigate to the left-most dropdown in the toolbar to select your genome.
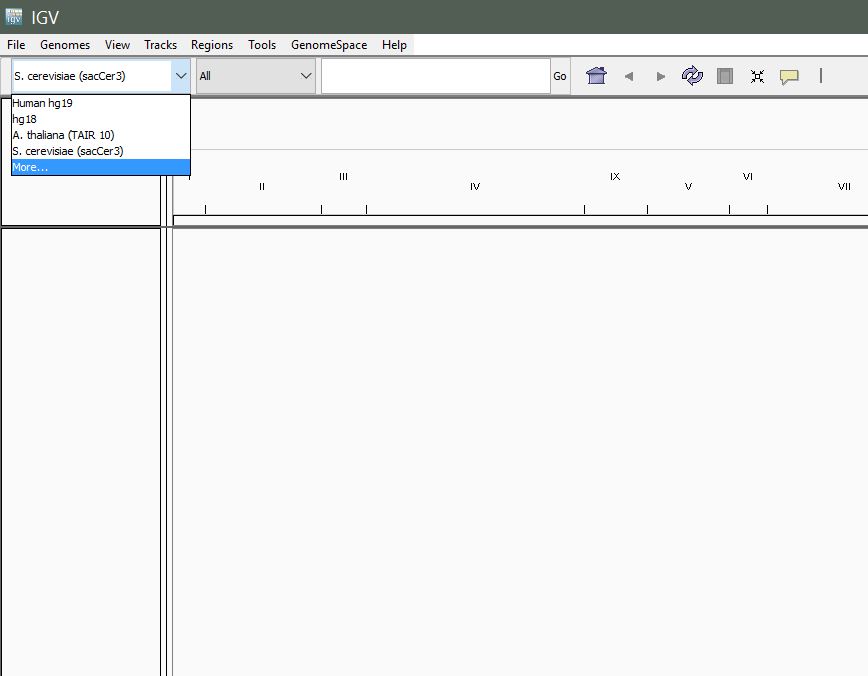
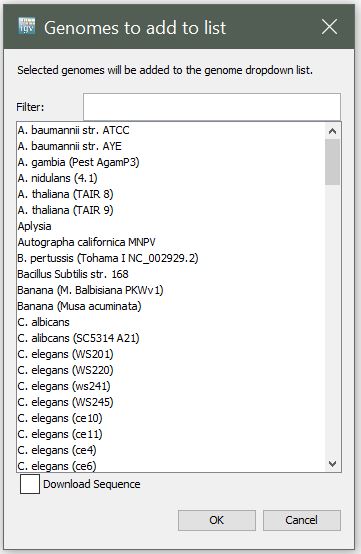
Select “More…” to see the full list of available genomes.
3) Create a Custom Genome
In case you are working with an organism for which there is no pre-existing genome in IGV, you can create a custom genome quite easily.
Requirements:
- Reference sequence (in Fasta format)
- Gene annotations (in .GFF format)
From the menu, select Genomes > Create .genome File
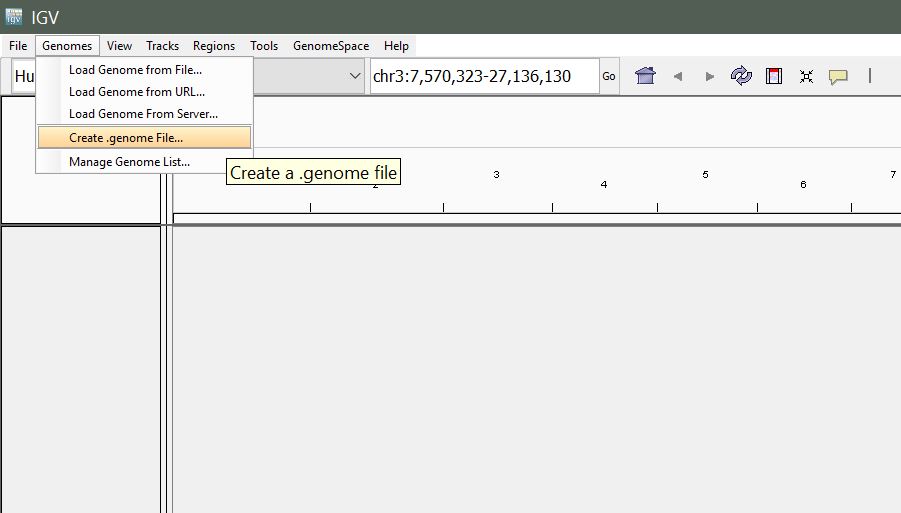
You will be presented with the following window. Enter a unique identifier and descriptive name (these can be anything that makes sense to you) and select the path to the reference fasta file, and path to your gene annotation (gff) file for the Gene File.
Note: A fasta index (.fai) file needs to be in the same directory as the reference sequence (.fasta)
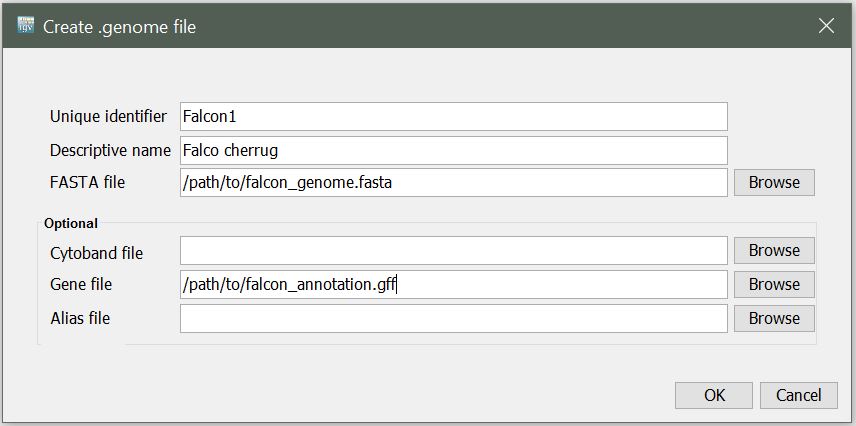
Upon clicking OK, you will be prompted to select name and location to save your new .genome file.
4) Loading Alignment Data
Once you’ve loaded your reference genome, you can load your mapped reads. Note that your reads must be sorted and indexed prior to loading.
From the menu, select File > Load from File
Locate the aligned_reads.sorted.bam file (prepared for you) and click Open. You should see something like the following:
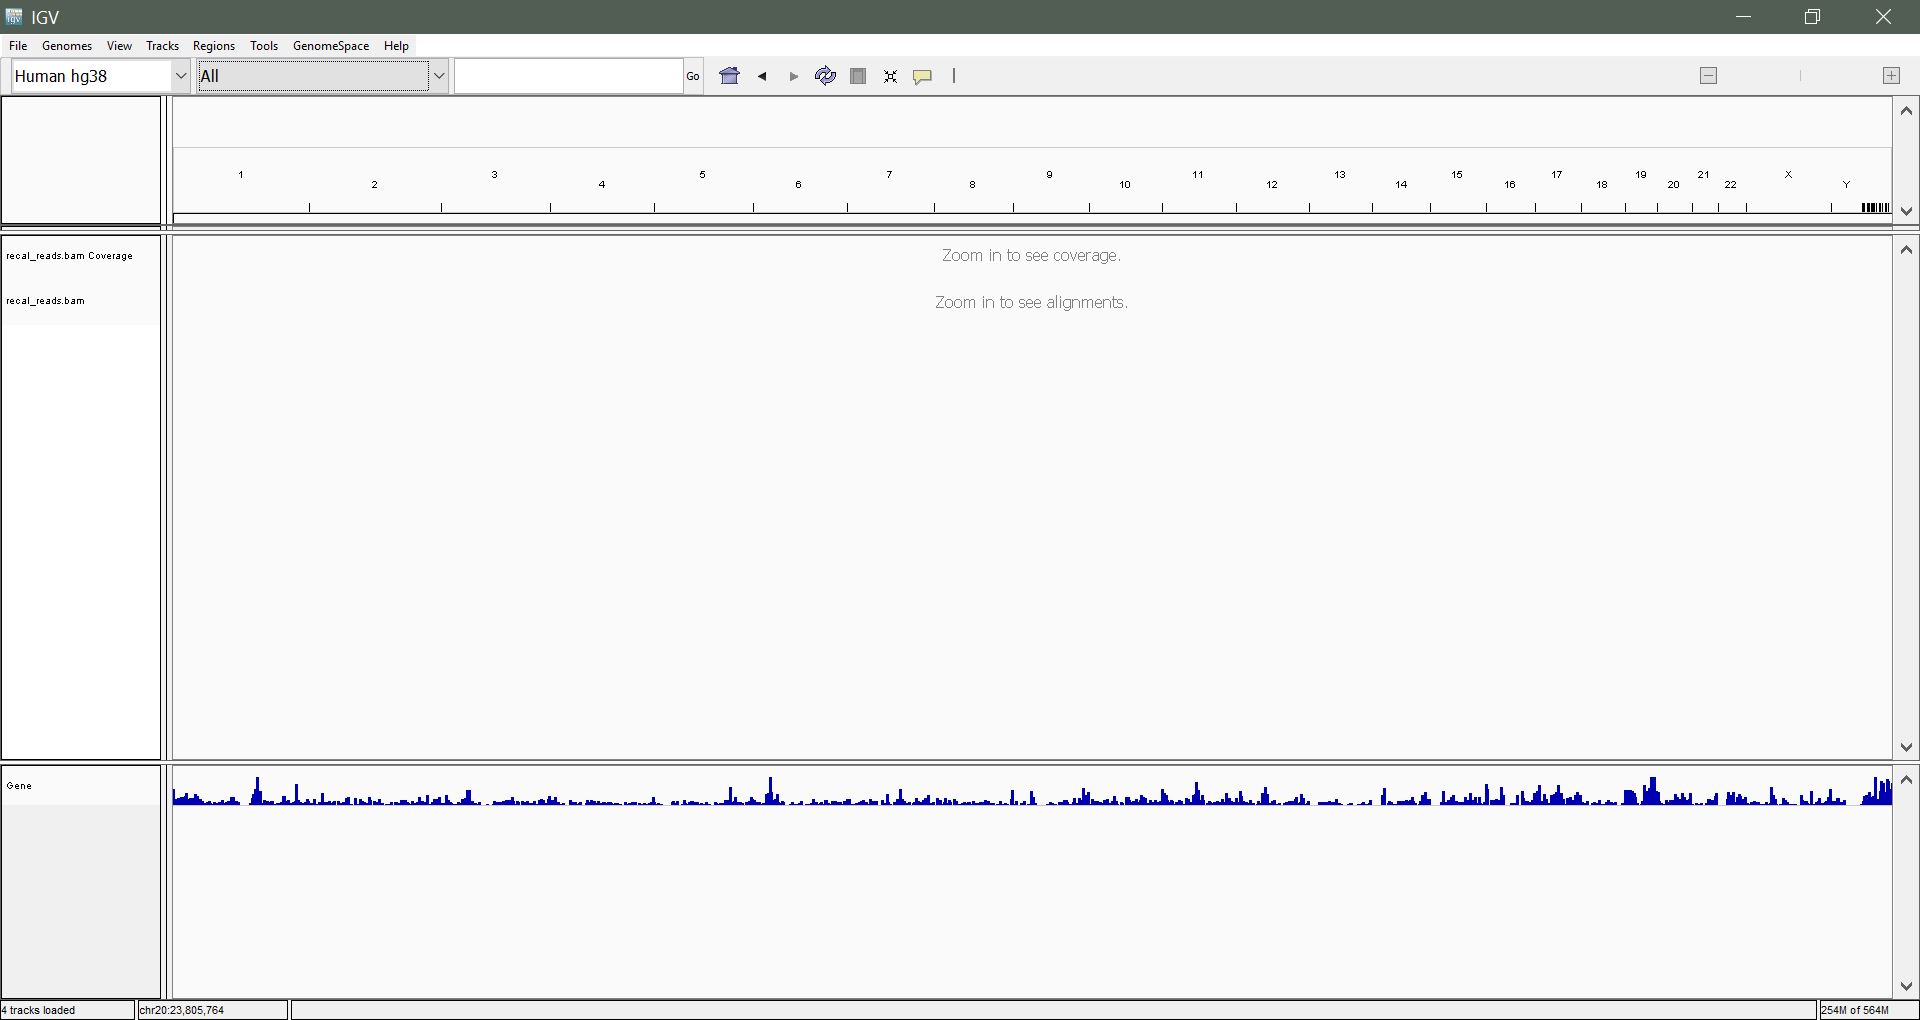
5) Navigation and Interpretation of Data
Navigating by chromosome: Use the drop-down menu beside the Genome drop-down list to select a chromosome to view. In our sample alignment, we have reads from chromosome 20 only. Alternatively, enter the chromosome name in the search box (”chr20″) and hit enter.
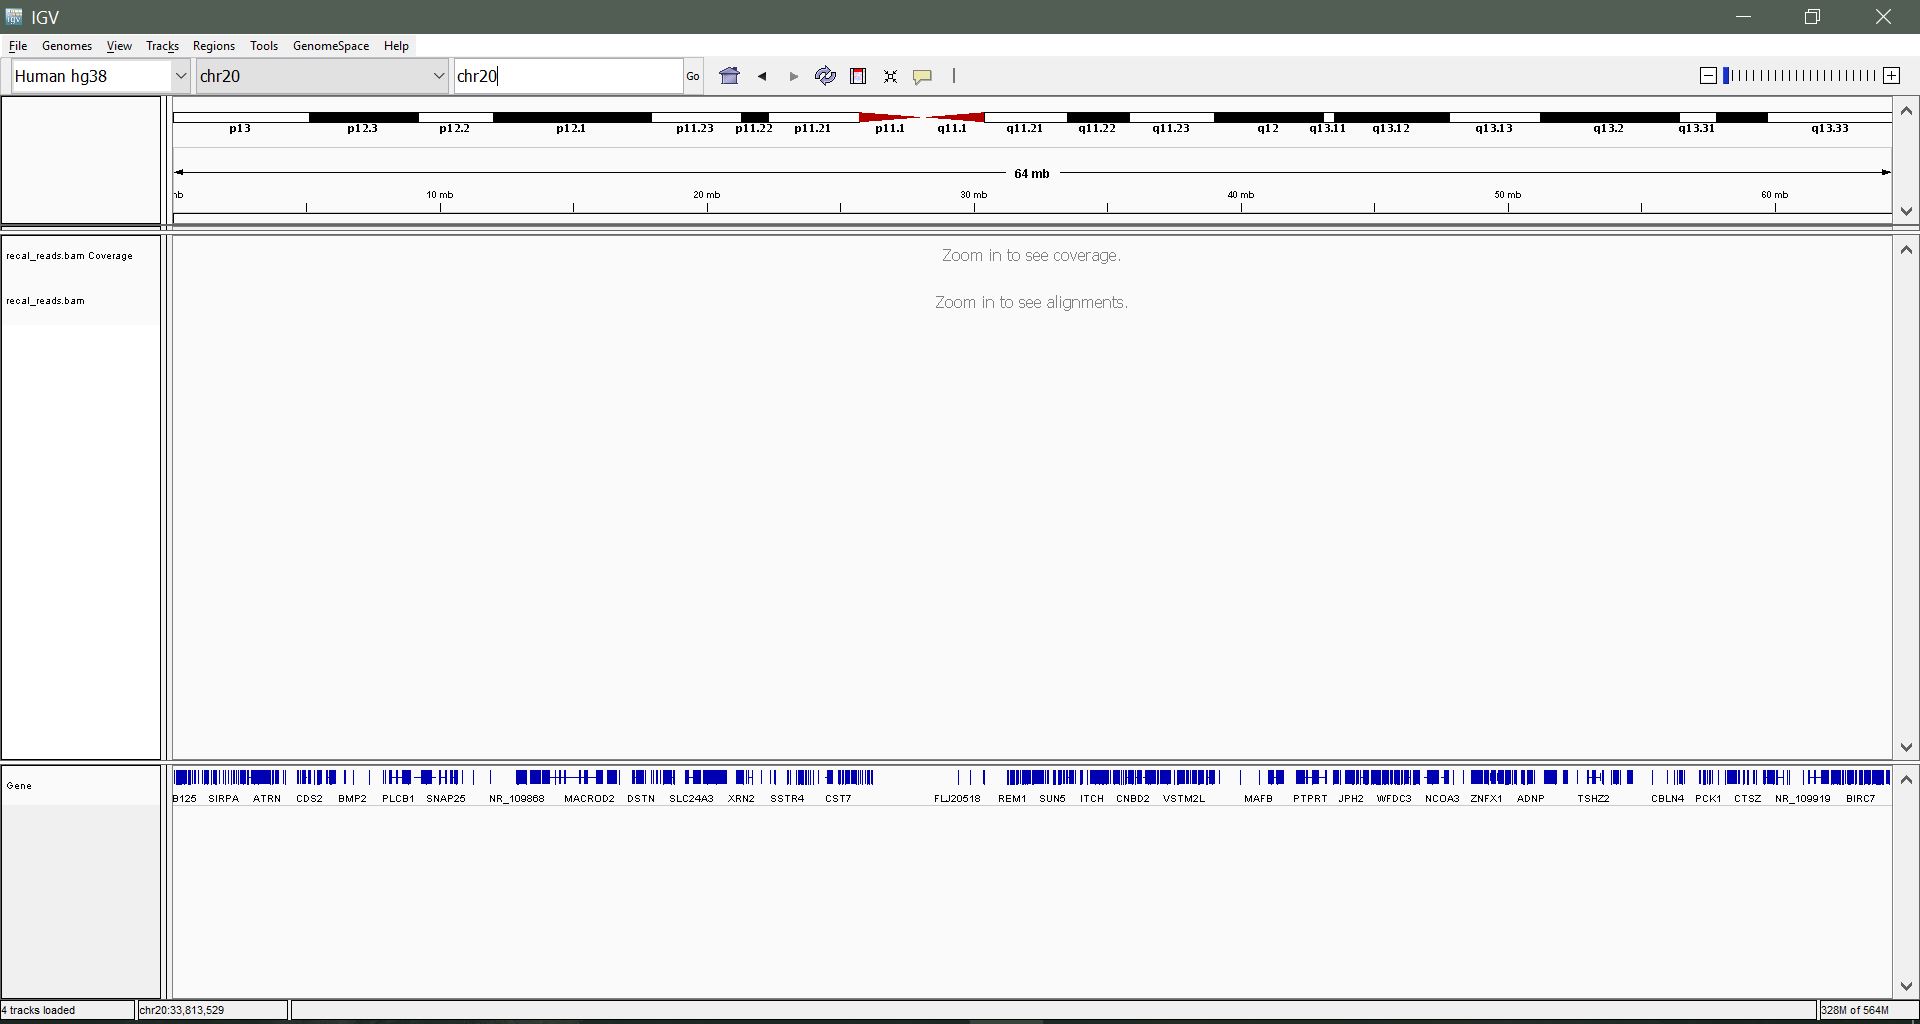
Zooming in: We still can’t see much. Let’s zoom in to a region within 23,500,000 – 24,000,000 until you begin to see some mapped reads. Use the slider on the top right to zoom incrementally, or click and drag a region to zoom to on the coordinates.
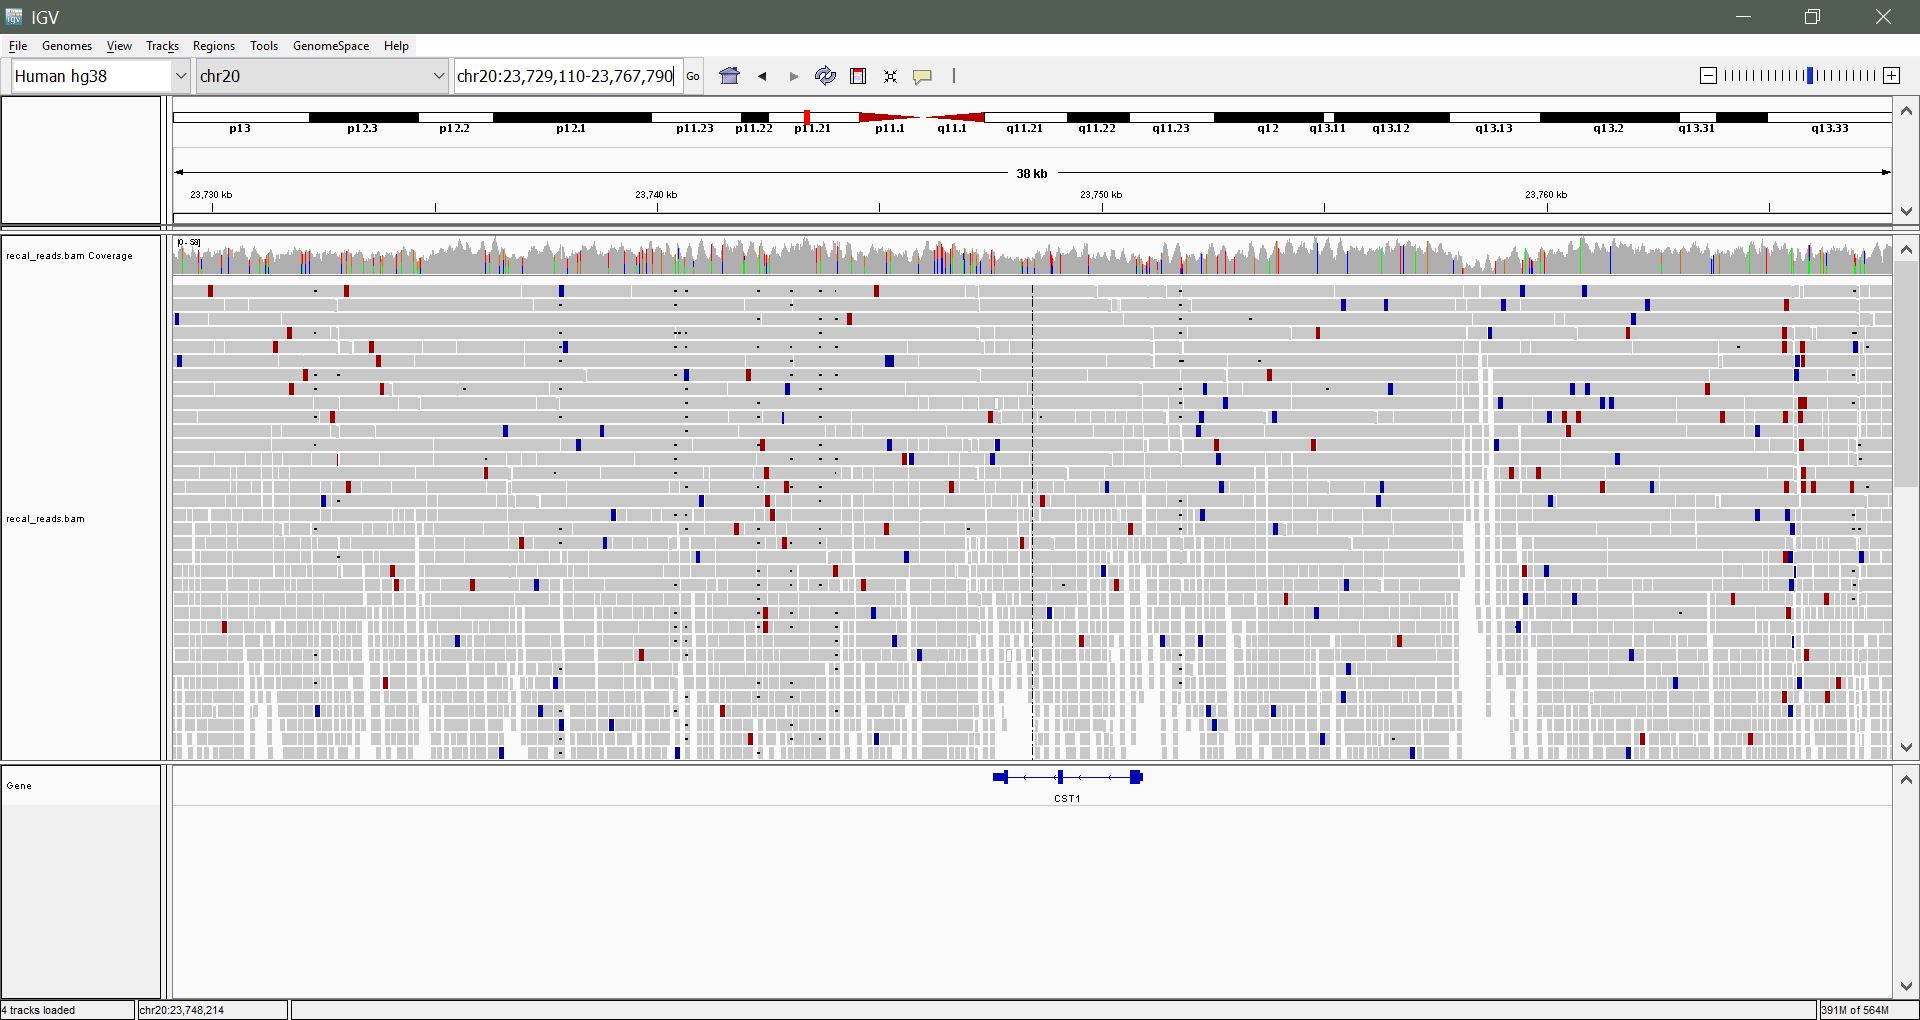
Navigating using the keyboard: Once you are in a region of interest, use the arrow, home, end, page-up and page-down keys to explore the region
Navigate directly to a region of interest: Enter a gene name or coordinates in the search box to navigate directly to that feature/region. Example: CST4 or chr20:23,675,452-23,682,868
Change the appearance of genes: Right click on the gene track and select ‘expanded’. Navigate to gene GGTLC1 to see the difference. Try ‘squished’ also.
Change the appearance of reads: Right click on the BAM track and experiment with some of the different options: View as pairs, Show all bases, Shade bases by quality. We will discuss these options.
Exercise:
Color coded reads: You might see red and blue reads. What do these represent? What might this suggest?
For more details check out the IGV User Guide: http://software.broadinstitute.org/software/igv/UserGuide